The meshgrid() method takes two or more 1D arrays representing coordinate values and returns a pair of 2D arrays. It creates a rectangular grid out of an array of x values and an array of y values.
import numpy as np

# 1D arrays as x and y coordinates
x = np.array([1, 2, 3])
y = np.array([10, 20])

# create a 2D grid using meshgrid
X, Y = np.meshgrid(x, y)

# print the created grid
print("X values:\n", X)
print("\nY values:\n", Y)

'''
Output:
X values:
[[1 2 3]
 [1 2 3]]

Y values:
 [[10 10 10]
 [20 20 20]]
'''
Given two arrays x and y, meshgrid() returns an array of all possible coordinate points (xi, yi) for all xi in x and yi in y.
meshgrid() Syntax
The syntax of meshgrid() is:
numpy.meshgrid(*xi, copy = True, sparse = False, indexing = 'xy')
meshgrid() Argument
The meshgrid() method takes the following arguments:
*xi- 1D arrays representing the coordinates of a gridindexing(optional)- specifies index of the grid ('xy'(Cartesian, default) or'ij'(matrix) )sparse(optional)- aboolvalue, ifTruea sparse grid is returnedcopy(optional)- create a copy ifTrue(default) and return view ifFalse
meshgrid() Return Value
The meshgrid() method returns coordinate matrices from coordinate vectors.
Example 1: Create a 2-D Grid
import numpy as np

# create 1D arrays
x = np.array([1, 2, 3])
y = np.array([1, 2, 3])

# create a 2D grid using meshgrid
X, Y = np.meshgrid(x, y)

# print the created grid
print("X values:\n", X)
print("Y values:\n", Y)
Output
X values:
[[1 2 3]
 [1 2 3]
 [1 2 3]]
Y values:
 [[1 1 1]
 [2 2 2]
 [3 3 3]]
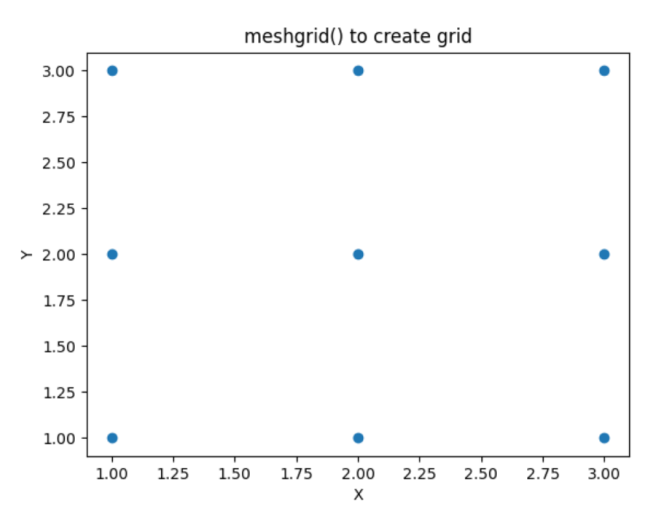
The code creates a 2D grid where the values of X and Y represent the coordinates of the grid points.
The X array represents the x-coordinates of the grid points, where each row contains the same x values [1, 2, 3]. The Y array represents the y-coordinates of the grid points, where each column contains the same y values [1, 2, 3].
To visualize the result of meshgrid(), we can use matplotlib.
import numpy as np
import matplotlib.pyplot as plt

# create 1D arrays
x = np.array([1, 2, 3])
y = np.array([1, 2, 3])

# create a 2D grid using meshgrid
X, Y = np.meshgrid(x, y)

# create a scatter plot
plt.scatter(X, Y)

# set labels and title
plt.xlabel('X')
plt.ylabel('Y')
plt.title('meshgrid() to create grid')

# show the plot
plt.show()
Output

Example 2: Index in a 2-D Grid
In NumPy's meshgrid() method, the indexing parameter allows you to specify the indexing scheme used.
meshgrid() has two indexing options: 'xy' and 'ij'.
In the xy indexing approach, the first index refers to the row (y-coordinate) and the second index refers to the column (x-coordinate).
In the ij indexing approach, the first index refers to the column (i-coordinate) and the second index refers to the row (j-coordinate)
Lets see an example.
import numpy as np

# create 1D arrays
x = np.array([1, 2, 3])
y = np.array([10, 20])

# using xy indexing in meshgrid
XX, YY = np.meshgrid(x, y, indexing='xy')
print("Using xy indexing:")
print("XX values:\n", XX)
print("YY values:\n", YY)
print()

# using ij indexing in meshgrid
XX, YY = np.meshgrid(x, y, indexing='ij')
print("Using ij indexing:")
print("XX values:\n", XX)
print("YY values:\n", YY)
Output
Using xy indexing:
XX values:
[[1 2 3]
 [1 2 3]]
YY values:
 [[10 10 10]
 [20 20 20]]

Using ij indexing:
XX values:
 [[1 1]
 [2 2]
 [3 3]]
YY values:
 [[10 20]
 [10 20]
 [10 20]]
With indexing='xy', the first array XX corresponds to the x-coordinates and the second array YY corresponds to the y-coordinates.
With indexing='ij', the first array XX corresponds to the i-coordinates and the second array YY corresponds to the j-coordinates.
Example 3: Using sparse Argument in meshgrid
You can create sparse output arrays to save memory and computation time.
import numpy as np

# create 1D arrays
x = np.array([1, 2, 4])
y = np.array([10, 20, 30, 40])

# create a  grid
XX, YY = np.meshgrid(x, y)
print("Grid: ")
print("XX values:\n", XX)
print("YY values:\n", YY)

# create a sparse grid
XX, YY = np.meshgrid(x, y, sparse=True)
print("Sparse Grid: ")
print("XX values:\n", XX)
print("YY values:\n", YY)
Output
Grid:
XX values:
[[1 2 4]
 [1 2 4]
 [1 2 4]
 [1 2 4]]
YY values:
 [[10 10 10]
 [20 20 20]
 [30 30 30]
 [40 40 40]]

Sparse Grid:
XX values:
 [[1 2 4]]
YY values:
 [[10]
 [20]
 [30]
 [40]]
Related topics:
ogrid(): A NumPy function that creates a sparse multi-dimensional grid of values after you specify the start, stop, and step values for each dimension.
mgrid(): A NumPy function that creates a dense multi-dimensional grid of values after you specify the start, stop, and step values for each dimension.
Let's see an example.

import numpy as np

# using mgrid to create a dense multi-dimensional grid
mGridX, mGridY = np.mgrid[0:10:2, 0:5]

print('For mgrid,')
print('X values:\n', mGridX)
print('Y values:\n', mGridY)

# using ogrid to create an open multi-dimensional grid
oGridX, oGridY = np.ogrid[0:10:2, 0:5]

print('\nFor ogrid,')
print('X values:\n', oGridX)
print('Y values:\n', oGridY)
Output
For mgrid,
X values:
[[0 0 0 0 0]
 [2 2 2 2 2]
 [4 4 4 4 4]
 [6 6 6 6 6]
 [8 8 8 8 8]]
Y values:
 [[0 1 2 3 4]
 [0 1 2 3 4]
 [0 1 2 3 4]
 [0 1 2 3 4]
 [0 1 2 3 4]]

For ogrid,
X values:
[[0]
 [2]
 [4]
 [6]
 [8]]
Y values:
 [[0 1 2 3 4]]