The exp() function is used to calculate the exponential values of the elements in an array.
import numpy as np

array1 = np.array([1, 2, 3, 4, 5])

# use of exp() to calculate the exponential values of each elements in array1
result = np.exp(array1)

print(result)

# Output : [  2.71828183   7.3890561   20.08553692  54.59815003 148.4131591 ]
exp() Syntax
The syntax of exp() is:
numpy.exp(array)
exp() Arguments
The exp() function takes one argument:
array- the input array
exp() Return Value
The exp() function returns an array that contains the exponential values of the elements in the input array.
Example 1: Use of exp() to Calculate Natural Logarithm
import numpy as np

# create a 2-D array
array1 = np.array([[1, 2, 3],
                                [4, 5, 6]])

# use exp() to calculate the exponential values each element in array1
result = np.exp(array1)

print(result)
Output
[[  2.71828183   7.3890561   20.08553692]
 [ 54.59815003 148.4131591  403.42879349]]
Here, we have used the np.exp() function to calculate the exponential values of each element in the 2-D array named array1.
The resulting array result contains the exponential values.
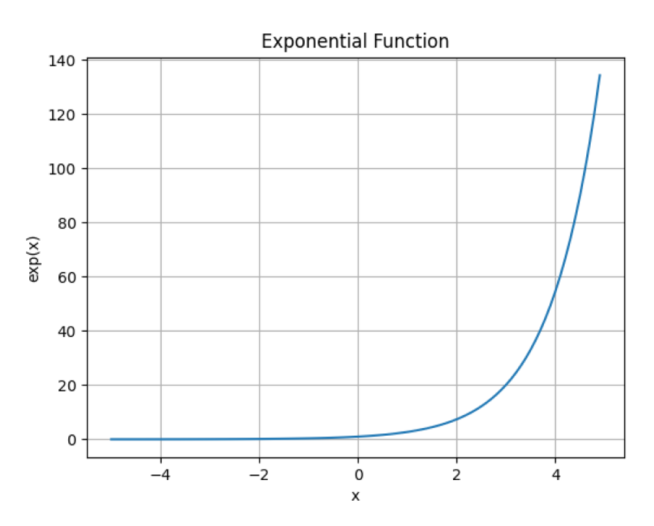
Example 2: Graphical Representation of exp()
To provide a graphical representation of the exponential function, let's plot the exponential curve using matplotlib, a popular data visualization library in Python.
To use matplotlib, we'll first import it as plt.
import numpy as np
import matplotlib.pyplot as plt

# generate x values from -5 to 5 with a step of 0.1
x = np.arange(-5, 5, 0.1)

# compute the exponential values of x
y = np.exp(x)

# Plot the exponential curve
plt.plot(x, y)
plt.xlabel('x')
plt.ylabel('exp(x)')
plt.title('Exponential Function')
plt.grid(True)
plt.show()
Output

In the above example, we plot x on the x-axis and y, which contains the exponential values, on the y-axis using plt.plot(x, y).